|
The standard samples technique is based on comparison of IL intensities from the element of interest in the standard
sample and multi-component sample, both of them in-situ. If the standard and investigated samples are close in
composition and are measured in identical conditions, the expression for IL intensity contains the same quantities except
for concentrations (6.1.2). Then the ratio of IL intensities for measured
 and standard and standard  samples is
proportional to the ratio of element's concentrations in measured samples is
proportional to the ratio of element's concentrations in measured  and
standard and
standard  samples: samples:
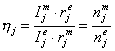 |
(7.2.1) |
Depending on the IL representation, the intensities and
are determined respectively:
as areas I(E) under the IL contour N(E) in the integral representation;
as peak-to-peak distances (distances between IL extrema) in dN/dE representation.
The compositions of measured and standard samples can differ substantially and the intensity ratio
/ can noticeably differ
from unity. In this case one has to consider unequal influences of EBE factors in expressions
(6.1.2 - 6.1.3, see also note) on
and .
While the matrix effects (primarily - EBE factor) are neglected, an error in concentration calculation is greater
when the compositions and electron spectra of measured and standard samples differ stronger.
|